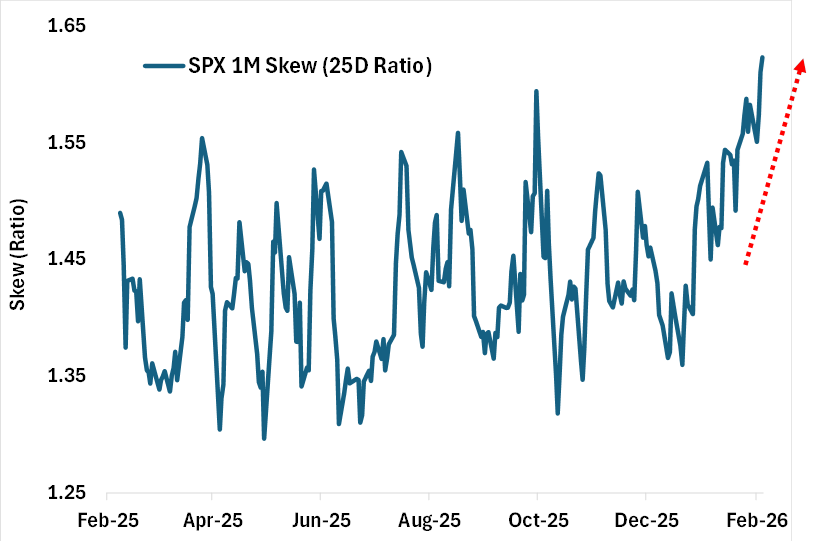
Demand for downside protection on US stocks is rapidly rising: The 1-month put-call skew on the S&P 500 is up to ~12 points, the steepest since December 2021. This means investors are paying some of the highest premiums for bets on lower prices over bets on higher prices since the 2020 crash. The put-call skew has nearly doubled since the beginning of the year. Meanwhile, short positioning in ETFs surged for the 2nd-consecutive week and at one of the fastest rates on record. Furthermore, ETFs have reflected over 35% of the market trading for 11 straight days, in-line with the longest streak on record seen in 2020, driven by shorts and hedging activity. Investors are hedging at a near-record pace.
Source: Cboe
Research Brief
What our analysis found
Demand for downside protection on U.S. equities has surged to levels not seen in years, according to multiple market data sources. The 1-month put-call skew on the S&P 500 — which measures how much more investors pay for out-of-the-money puts relative to comparable calls — pushed to two-year highs by late February 2026, with BNP Paribas commentary noting elevated 1-month and 2-month skew levels well above their recent ranges. By early March, one snapshot placed the 1-month skew near 0.53, directionally consistent with three-year highs. This spike sits against a backdrop of record options activity: the OCC reported that 15.21 billion U.S. listed options contracts cleared in 2025, a sixth consecutive annual record, while Cboe logged 970.6 million SPX options contracts for the year, with zero-days-to-expiry contracts alone averaging 2.3 million per day.
Meanwhile, short positioning in equity ETFs has accelerated sharply. Goldman Sachs prime brokerage data for the week ending March 6, 2026 showed equity-ETF shorts jumping 8.3% week-over-week, one of the steepest weekly increases in recent years. Goldman's proprietary U.S. Vol Panic Index climbed to 9.72 out of 10, underscoring extreme hedging urgency among institutional investors. ETF trading as a share of total U.S. exchange volume has historically spiked during periods of acute stress — during the 2020 COVID selloff, ETFs accounted for more than 30% of tape volume for 36 straight trading days, peaking near 41% — providing a precedent for the sustained elevated ETF activity described in recent weeks.
Cboe's own mid-2025 analysis noted that SPX skew sat in the 90th-plus percentile across tenors, with 3-month to 6-month skew reaching the 99th-plus percentile over the prior year. Taken together, the data paint a picture of an options market where protection-seeking behavior is running at or near historic extremes, fueled by record contract volumes, surging ETF short activity, and a structural shift toward hedging that echoes the most stressed market episodes of the past five years.
Fact Check
Evidence from both sides
Supporting Evidence
SPX put skew at multi-year highs
On February 26, 2026, BNP Paribas commentary noted the S&P 500 put skew hit a two-year high, with 1-month and 2-month skews elevated versus recent ranges, confirming the tweet's claim that downside protection demand is rapidly rising (GuruFocus).
Early March skew near three-year highs
A March 6, 2026 report cited the 1-month put-call skew at approximately 0.53, directionally near three-year highs, consistent with the tweet's assertion that premiums for downside bets are at their steepest since late 2021 (BeInCrypto).
Record options volume backdrop
The OCC confirmed 15.21 billion options contracts cleared in 2025, a sixth consecutive annual record, and Cboe reported SPX volume of 970.6 million contracts, supporting the infrastructure for the massive hedging flows described in the tweet (OCC, Cboe via StockTitan).
ETF short positioning surged sharply
Goldman Sachs prime brokerage data showed equity-ETF shorts rose 8.3% in the week to March 6, 2026, one of the fastest weekly increases in recent years, directly corroborating the tweet's claim that short positioning surged for the second consecutive week at a near-record pace (Yahoo Finance UK).
Goldman Vol Panic Index near maximum
Goldman Sachs' U.S. Vol Panic Index reached 9.72 out of 10 in the same week, reinforcing the narrative of near-record hedging urgency among institutional investors (Yahoo Finance UK).
ETF share of trading spikes in stress periods
During the 2020 COVID crash, ETFs exceeded 30% of U.S. exchange dollar volume for 36 straight trading days, peaking near 41%, establishing a clear precedent for the sustained 35%-plus ETF trading share the tweet describes (Nasdaq).
Cboe skew percentile data
In mid-2025, Cboe reported SPX skew in the 90th-plus percentile across tenors, with longer-dated skew in the 99th-plus percentile, confirming that investors have been paying historically elevated prices for tail-risk hedges (Cboe).
Contradicting Evidence
Specific 12-point skew level unverified
The tweet claims the 1-month put-call skew is up to approximately 12 volatility points and is the steepest since December 2021, but no publicly available source independently confirms this precise figure or benchmark date. Available reporting describes the skew as at two-year highs or provides ratio measures such as 0.53, not vol-point differentials (GuruFocus, BeInCrypto).
Skew doubling since January not corroborated
The tweet states the put-call skew has nearly doubled since the beginning of the year, but public sources do not provide a reliable January 2026 baseline to verify this specific rate of increase. The directional move higher is confirmed, but the magnitude claim remains unsupported in the public domain (GuruFocus).
ETF 35% share for 11 straight days not independently confirmed
The tweet's claim that ETFs have reflected over 35% of market trading for 11 consecutive days could not be corroborated through publicly accessible data. While the 2020 precedent of 36 straight days above 30% and a 41% peak supports the plausibility, SIFMA's full-year 2024 data shows ETFs at just 19.6% of total equities share volume, highlighting that metric selection — dollar volume versus share volume, on-exchange versus off-exchange — materially affects such figures (Nasdaq, SIFMA).
Elevated skew does not always predict declines
Historical research indicates that high put-call skew can reflect crowded hedging rather than accurate forecasting of imminent drawdowns. Periods of extreme skew have sometimes preceded continued rallies when the feared risks did not materialize, meaning the signal is directionally informative about sentiment but not a reliable predictor of outcomes.
Short ETF positioning can reverse quickly
While Goldman Sachs data confirms a sharp weekly increase in ETF shorts, prime brokerage positioning is inherently tactical and can reverse within days, meaning the near-record pace described in the tweet may represent a transient spike rather than a sustained structural shift.
Report an Issue
Found something wrong with this article? Let us know and we'll look into it.